Logs and system monitor
When something does not behave, two pages tell you what the device sees: ==Logs==, the firmware's own log with the lines from before the last restart still in it, and ==System Monitor==, the live state of memory, tasks and temperature with the fault codes. Both are read-only views; nothing here changes a setting.
Logs
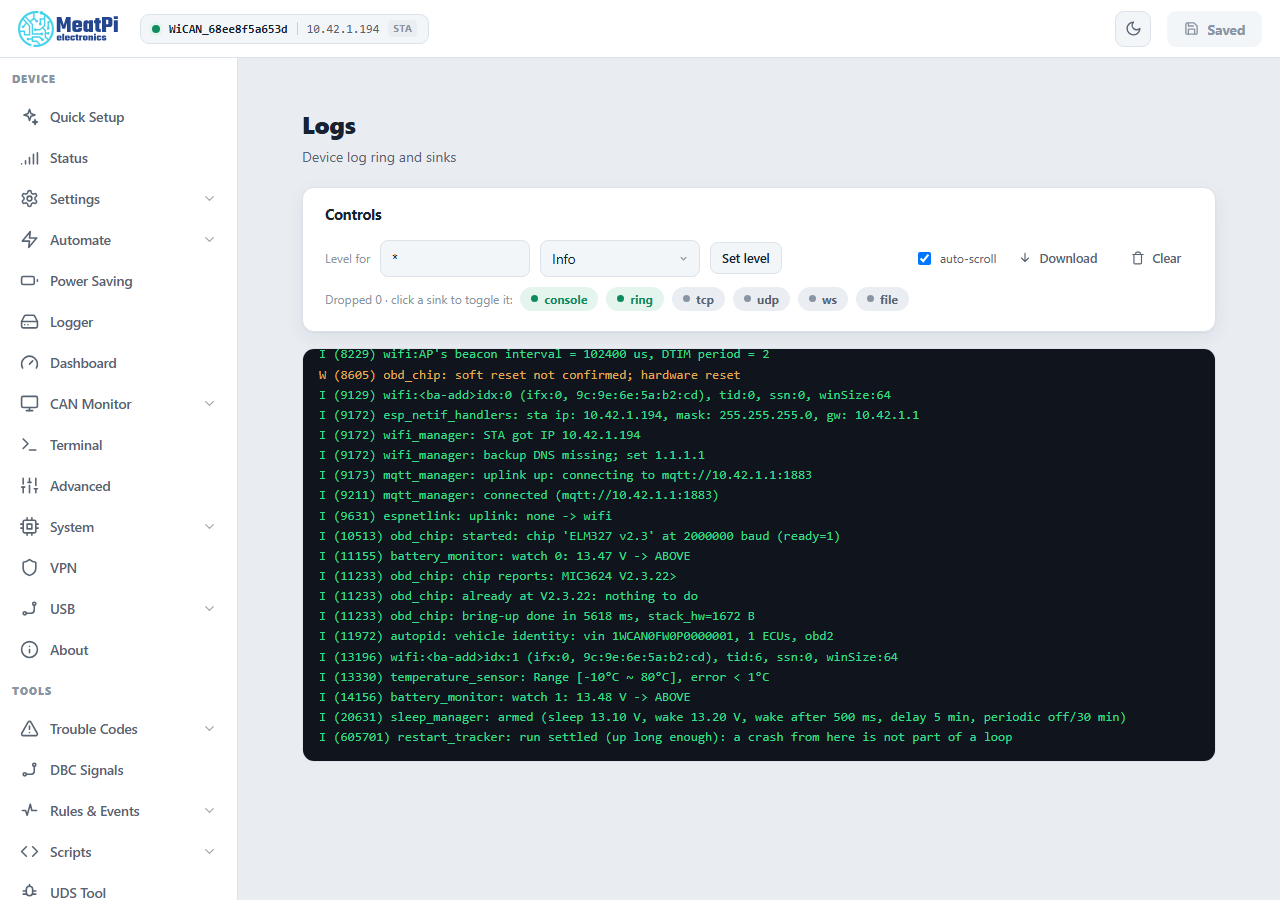
The log lives in a ring in RAM (16 KB) that survives a restart, so after a crash the lines that led to it are still there behind a ---- boot ---- separator. A power cut empties it. Lines are coloured by level: I information, W warning, E error.
- Level for a component tag (or
*for all) and a level (none,error,warn,info,debug,verbose), then Set level: takes effect at once and lasts until the restart. The boot default is a setting (All Settings › Log manager). - The sinks are where lines go:
console(the USB serial port),ring(this page), and four more that are off by default and need their settings under All Settings › Log sinks:tcp(a tail server to connect to with netcat),udp(lines pushed to a collector),ws(a WebSocket channel) andfile(rotated files on the SD card, flushed once a minute). Clicking a chip pauses or resumes a running sink; it cannot start one whose setting is off. - auto-scroll, Download (the ring as a text file: attach it to a bug report) and Clear.
Dropped Ncounts lines the device had to drop because a sink was too slow; a rising count means a sink over a bad link.
System Monitor
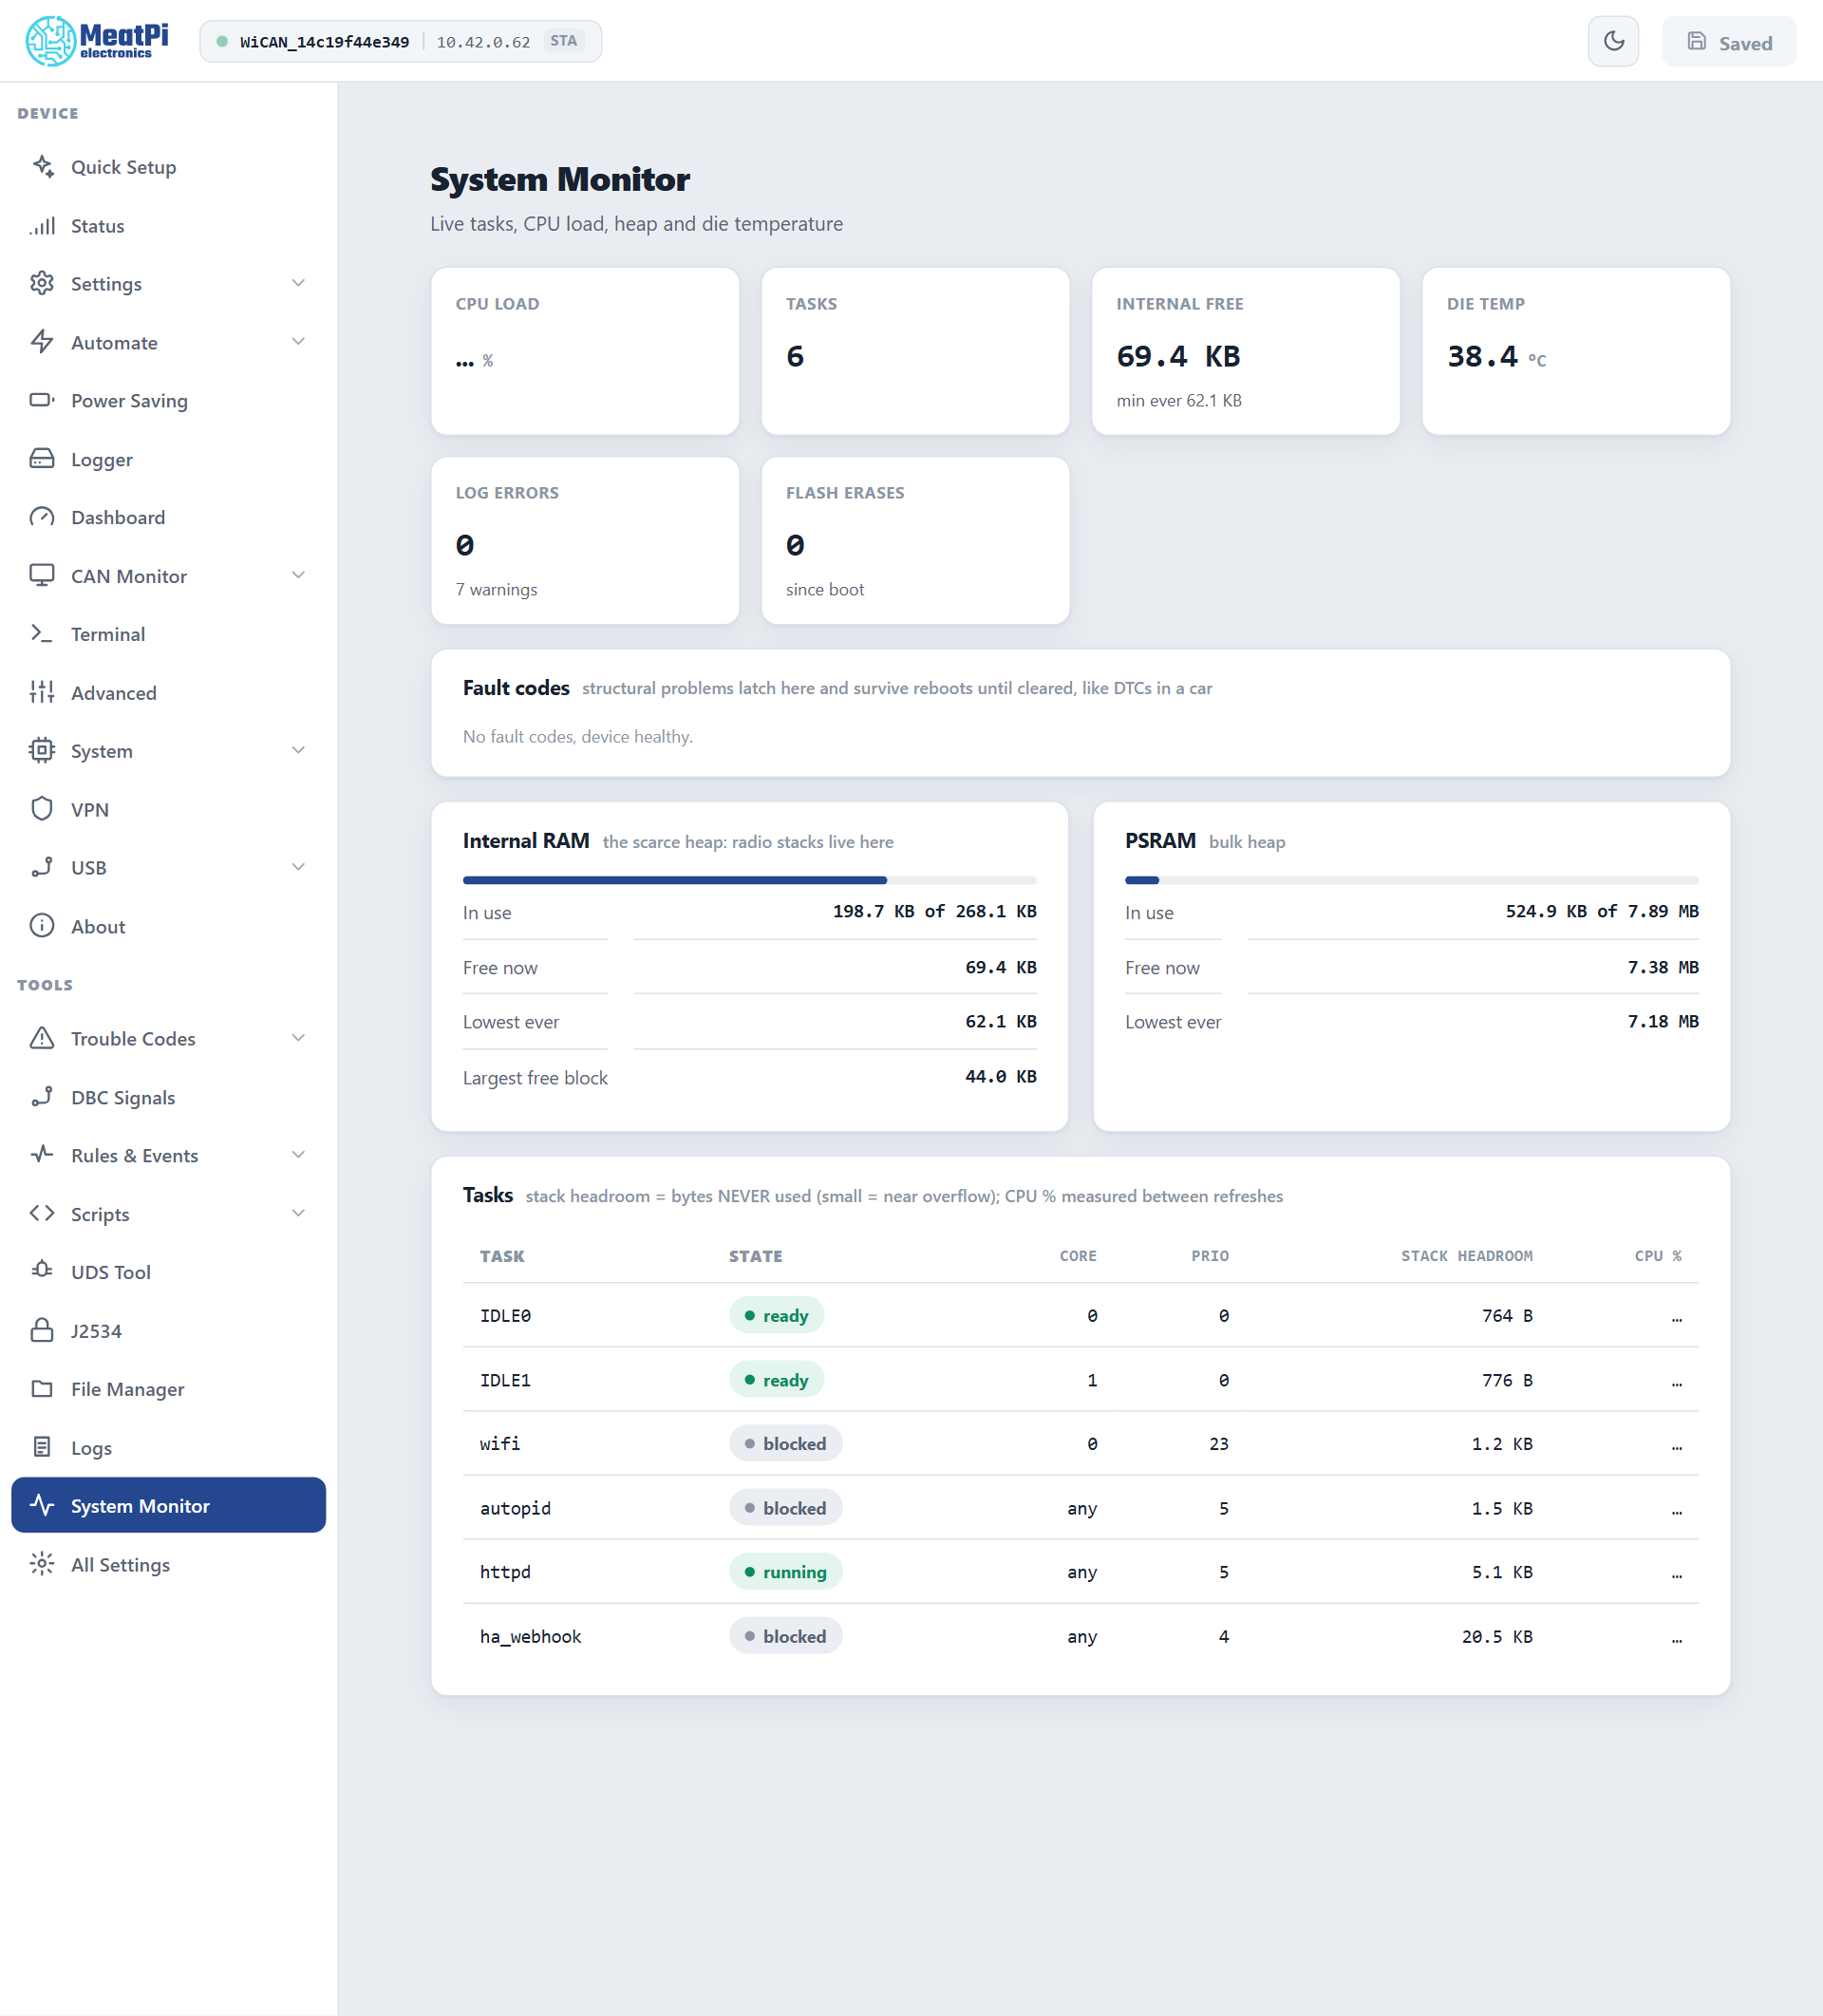
| Tile or card | What to read in it |
|---|---|
| CPU LOAD | the share of the two cores not idle, measured between refreshes |
| TASKS | how many tasks run; the table below lists them |
| INTERNAL FREE | the scarce heap the radios live in, with its lowest value since boot. Under 8 KB free, or a lowest value under 4 KB, the device latches the fault internal_ram_low and Bluetooth and the web server start to misbehave |
| DIE TEMP | the chip's temperature |
| LOG ERRORS | error and warning lines since boot |
| FLASH ERASES | flash erases since boot. A count that keeps rising while the device idles means something writes to flash continuously (the fault flash_churn says so after ten minutes) |
| Fault codes | the latched faults, see Faults |
| Internal RAM, PSRAM | in use, free now, the lowest ever, and for the internal heap the largest free block: a large free total with a small largest block is fragmentation |
| Tasks | per task: state, core, priority, stack headroom (bytes the task never used: a small number means it is close to overflowing) and CPU share |
The same figures are in GET /api/status (memory, health, temp_c) and GET /api/status/tasks for a script that watches a device.
Reporting a problem
Attach three things: the log ring (Logs › Download) taken right after the problem, the firmware version (About), and the crash report when there is one (Crash report). A screenshot of System Monitor helps with memory questions.
Troubleshooting
| Symptom | Likely cause | What to do |
|---|---|---|
| The log is empty after a problem | the device lost power (the ring is RAM), or the ring sink is paused | the file sink on an SD card for a device that loses power; the stored crash report survives power |
Dropped keeps rising |
a slow sink | pause tcp or udp; use the ring |
| Too many lines to read | a tag at debug or verbose |
Set level back to info, or restart |
| Internal free keeps falling | a leak, or too many features at once (Bluetooth, VPN, the monitor stream, a logger) | note the figures and report; switch off what is not needed |